What is a financial model? A guide to financial modeling

A financial model is an important part of a financial forecast and can help you predict how your business will do financially in the future. Here’s how to understand financial models and how modeling your business’s financial profitability can help it do better.

What is a financial model

Quick links

What is a financial model?

Financial modeling is a complex term, and you can find a wide array of differing opinions as to what a financial model is exactly. The three main definitions of a financial model are:

  1. The Federal Reserve definition
  2. The Investopedia definition
  3. Danielle Stein Fairhurst’s definition

The Federal Reserve definition of a financial model

The first definition of a financial model is given by the Federal Reserve (SR11-7).

“A quantitative method, system or approach that applies statistical, economic, financial or mathematical theories, techniques, and assumptions to process input data into quantitative estimates.” 

This is a bureaucratic definition of a financial model. It is technical and not very useful for people who are just learning financial modeling and financial planning. In other words, it’s not particularly helpful for the majority of American business owners.

The Investopedia definition of a financial model

The second definition comes to us from Investopedia:

“Financial Modeling is the process of creating a summary of a company’s expenses and earnings in the form of a spreadsheet that can be used to calculate the impact of a future event or decision.”

The second definition is much easier to understand and is closer to our own definition of a financial model.  

Danielle Stein Fairhurst’s definition of a financial model

The third definition comes to us from financial modeling expert and author Danielle Stein Fairhurst, who defined a financial model in her book, Using Excel for Businesses and Financial Modeling, as:

A Complex Spreadsheet – As long as a spreadsheet has financial inputs and outputs, and is dynamic and flexible, I’m happy to call it a financial model!”

We like how this third definition focuses on how a model needs to (1) have financial inputs and outputs and (2) be dynamic and flexible, in order to be called a financial model. Unfortunately, as with the Federal Reserve definition, this definition doesn’t help lay people understand what financial modeling is and why it’s useful.

How would we define a financial model?

We focus on financial modeling for small businesses. Our definition of a financial model: a spreadsheet or application that helps us develop forecasts for business decisions so we can make the decision that optimizes our profits

Think of a financial model as the closest thing possible to a crystal ball. It attempts to peer into the future to see if choice A is superior to choice B. But instead of relying on intuition, experience, or advice, a financial model uses data to make its predictions.

A financial model could be as simple as performing an analysis of your lemonade stand to decide if it makes sense to buy a new juicer. In this case, you would use a model to figure out if buying a new juicer would be a good use of your money. You would compare the extra money you expect to make from the new juicer to the cost of the juicer. 

Profit Frog’s small business forecasting software makes financial modeling achievable for the average business owner, who may not have an MBA, be able to retain a suite of management consultants, or be a Microsoft Excel wizard. Start your free trial today

What information should be included in a financial model?

The information that should be included in a financial model will vary depending on the use and complexity of the model. Complex financial models, such as those commonly used by venture capital firms, are overkill for Main Street businesses. However, all financial models include the following elements:

  • Data: any applicable historical data or actuals such as prior period revenue, gross profit, and expenses (operating expenses and cost of goods sold).
  • Inputs and assumptions: every model will have some inputs or assumptions that are used in the model. Common inputs include:
  • Time period: how far out in the future do you want the model to forecast?
  • Key drivers and inputs: cost of capital, sales volume, number of people that will be needed to hire, etc.
  • Other assumptions such as tax rate, inflation rate, interest rate, etc. 
  • Calculations: these are the formulas used to determine the outputs. A calculation could involve multiplying the assumed price by the assumed volume sold to determine the revenue for a given time period (note that Profit Frog makes forecasting and calculation easy).
  • Outputs: this is where you summarize the key takeaways from the model. In an Excel spreadsheet, this would include an executive summary tab to summarize the main calculations from the model. In a forecasting tool like Profit Frog, outputs would be delivered as the final result after the software has walked you through inputting your data and assumptions and has run its calculations.

What does a financial model look like in Excel?

Traditionally, companies used Microsoft Excel to develop financial models. Here is an example of a financial model done in Excel for Garden Foods.  

(Don’t worry: if this Excel model looks way too complicated, we offer an easier way to do financial modeling for your small business.)

[get started with Profit Frog button]

The following Excel model was used to develop a profit and loss forecast over the next 4 years based on a predetermined set of business assumptions. We then applied a discount rate to see what the current value would be of the future cash flows one could expect to earn over the next 4 years.

Garden Foods can use this financial model to decide whether to proceed with a new subscription product or not. 

Below are screenshots of each page in the model and what they represent. This example is a basic model you would expect a finance professional to build using Excel.
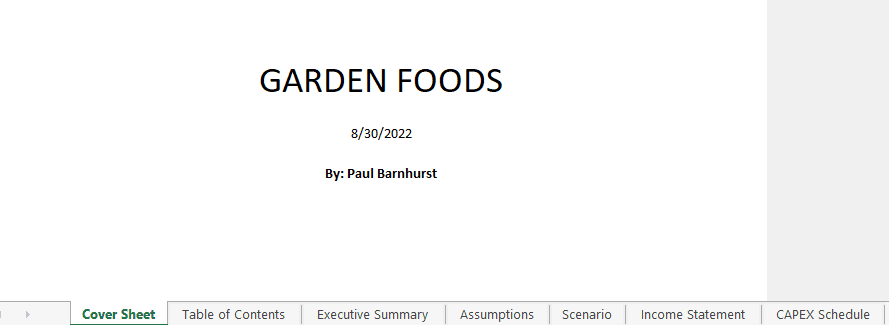
Cover sheet:

Models built in a spreadsheet tool should always include a cover sheet so someone can easily see what the model is, who built it, the date it was built, etc. 

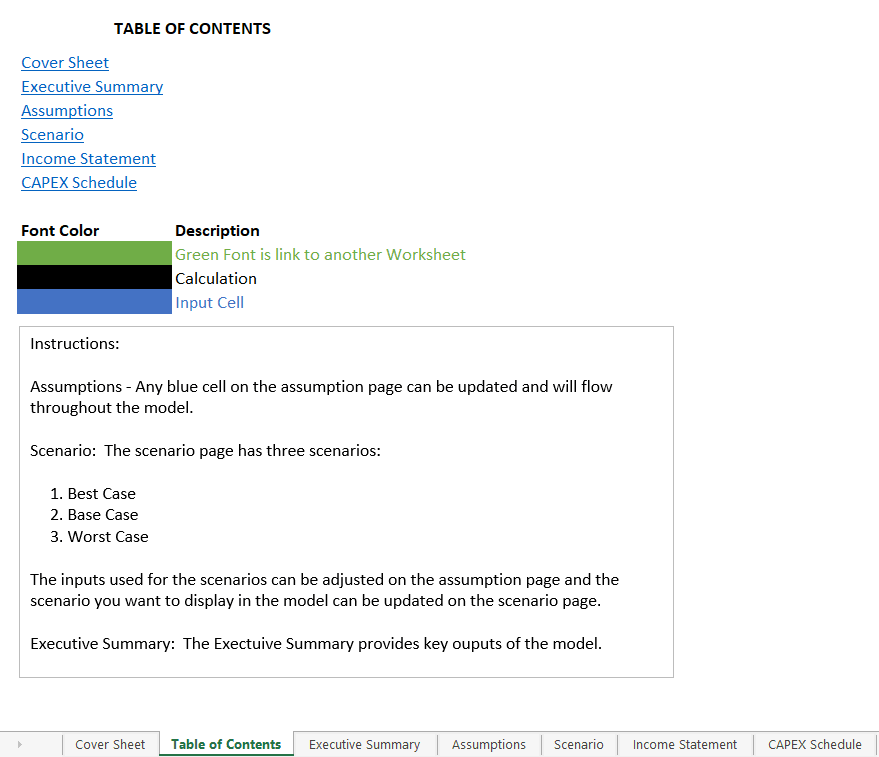
Table of contents: the table of contents includes a list of each page in the worksheet, along with some basic instructions about the model, including color coding used throughout the model to separate inputs, calculations, and links to other worksheets. Depending on the complexity of the model, the table of contents and instructions may all be on one page, or on separate pages. 

These instructions help ensure people who are not as well acquainted with financial modeling are able to pick up the model and use it to guide decision-making.  

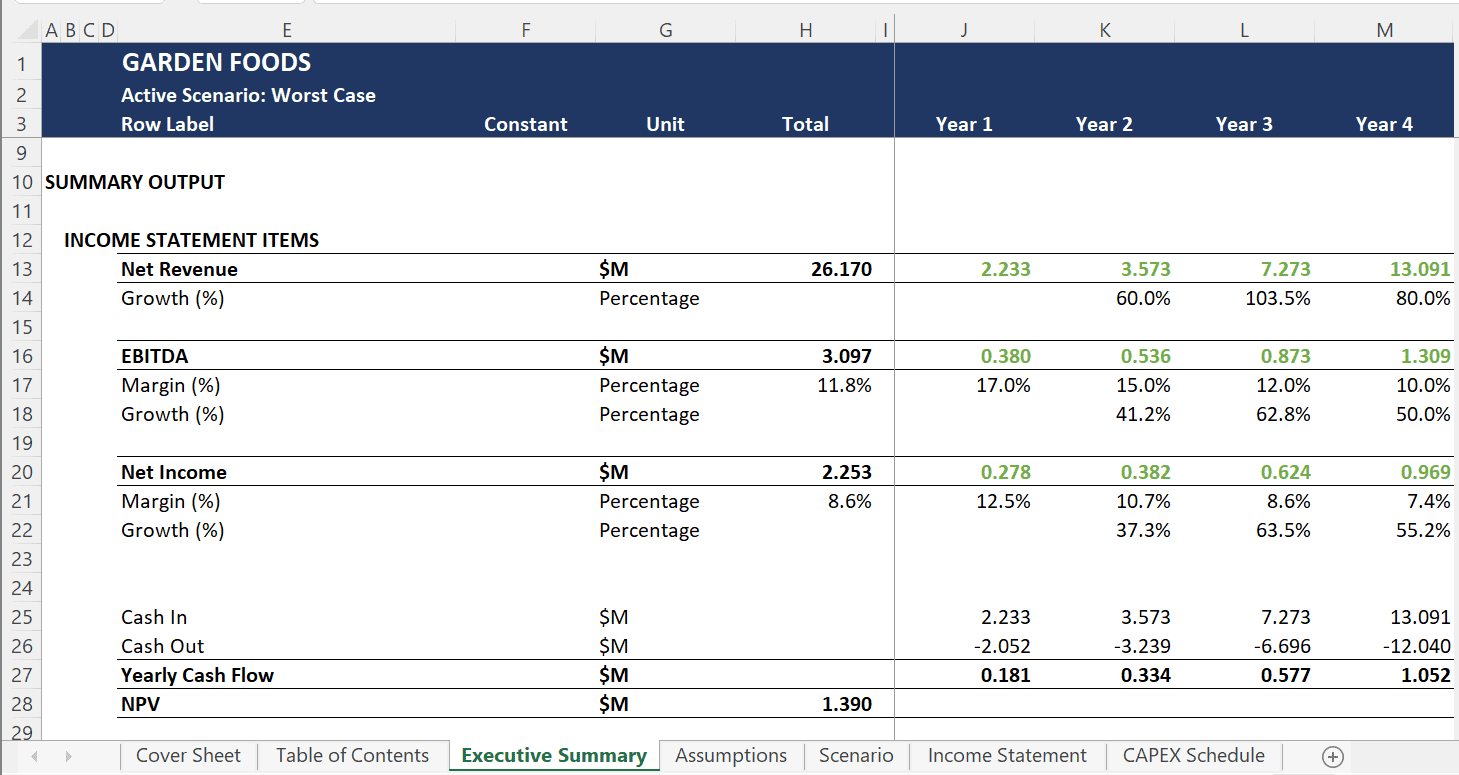
Executive summary: this provides an overview of key outputs of the model to be used by management. In the above example, key outputs include revenue, EBITDA, income, and the net present value (NPV) of cash earned from this potential opportunity. 

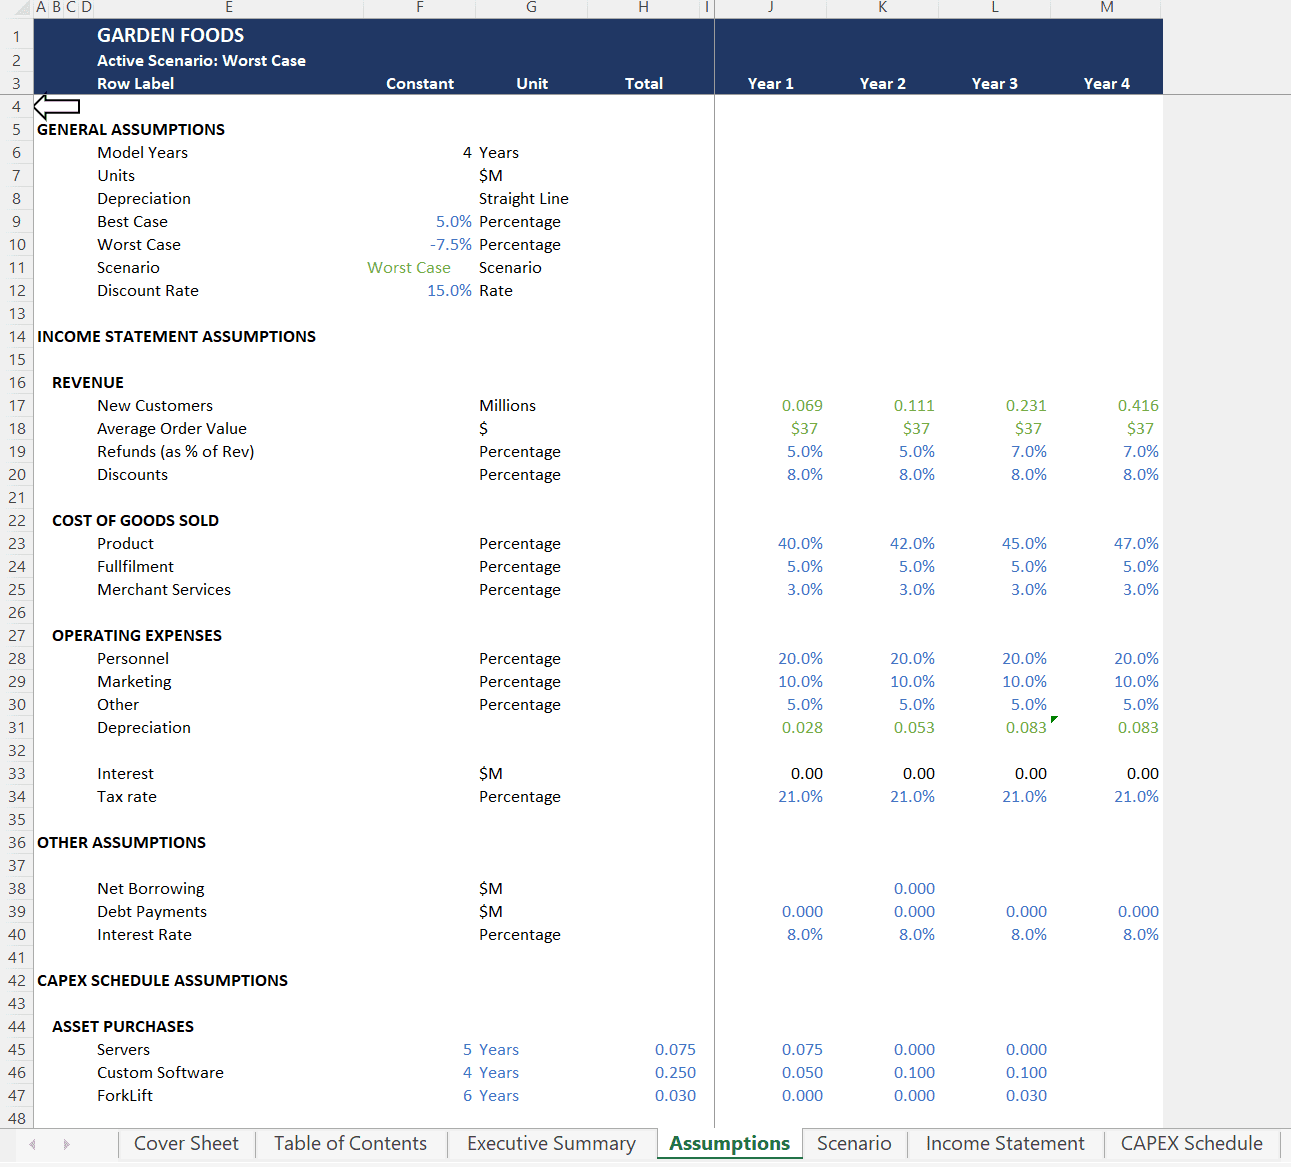
Assumptions: this tab includes all the assumptions in the model. In this case, the model includes assumptions on operating expenses, revenue, the cost of goods sold, etc.

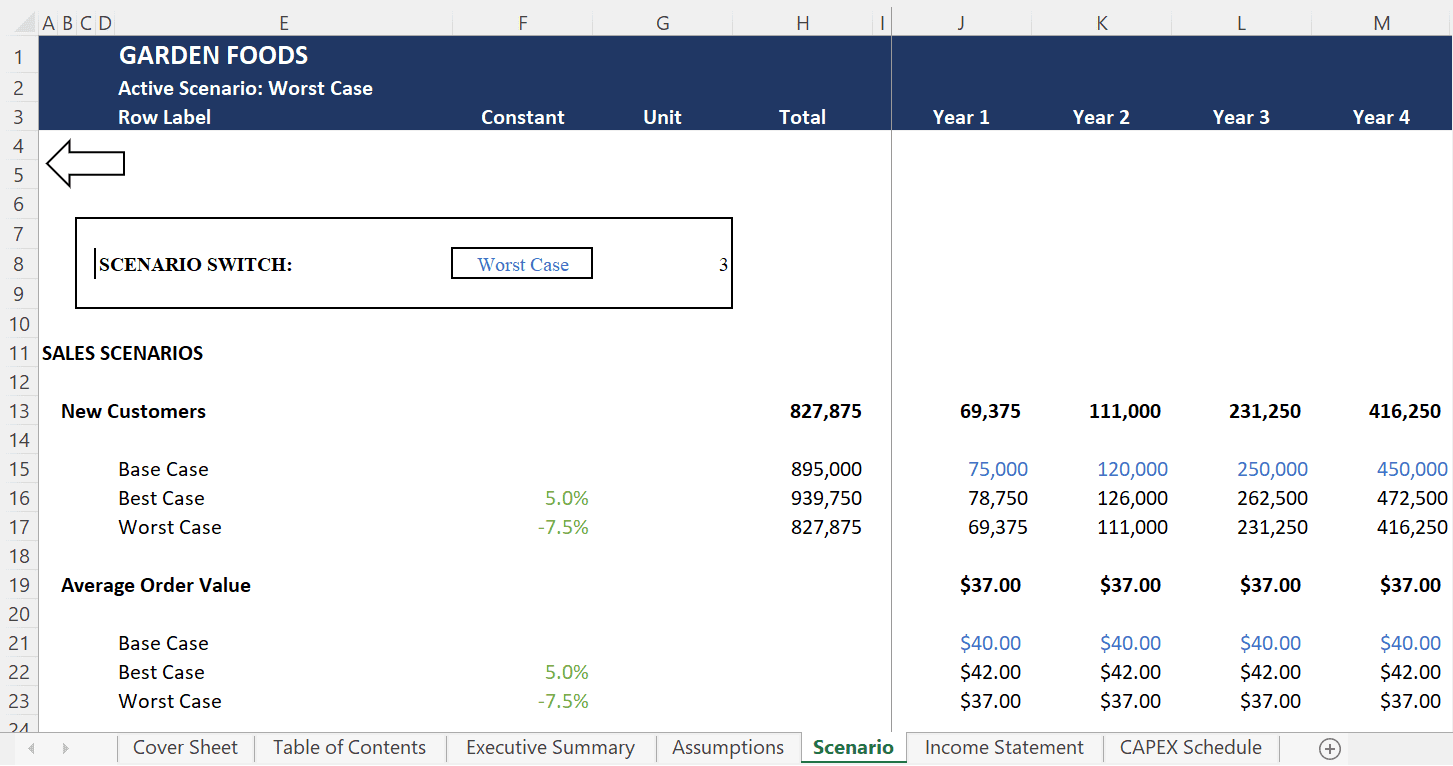
Scenario: this tab is used to forecast different scenarios for the model. This simple model has a best case, a base case, and a worst case scenario. It helps us determine if the business venture still makes sense under different scenarios, as opposed to analyzing the business case using only one scenario. 

Income statement: the income statement includes all the calculations based on the financial model’s assumptions needed to show the revenue, net income, and EBITDA earned each year during the project. 

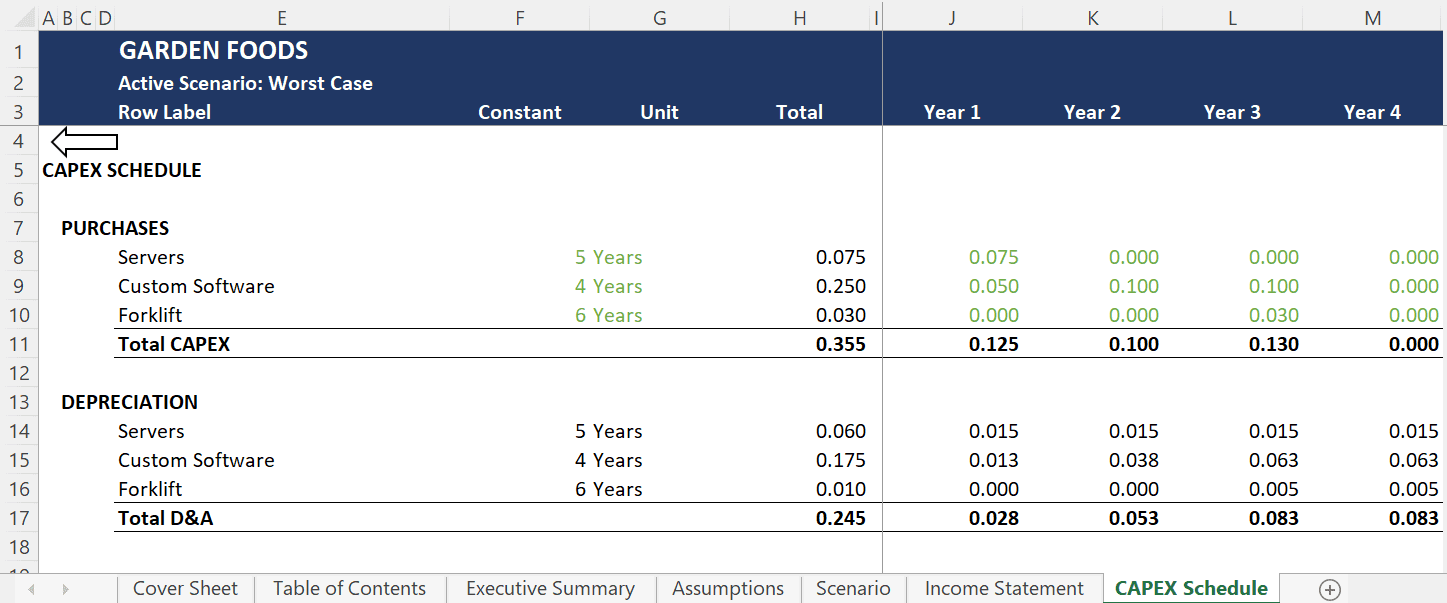
CAPEX schedule: this is a schedule used to detail expenditures that will be needed for the project. These are expenses that, from a P&L accounting perspective, will be inevitable over the next few years due to depreciation. This allows us to understand the yearly cash outlays for large purchases that will only have value several years into the future.

Financial modeling is complicated in Excel

Does the Garden Foods example look more complicated than you could see yourself doing? Many owners of small businesses feel the same way. That’s why we created Profit Frog, an easy solution for financial modeling that is tailored to small businesses. We walk you through the financial modeling process so you don’t have to be an Excel wizard. 

Get started with your free Profit Frog trial today.

Financial modeling example with Profit Frog

Now that we’ve seen a financial model in Excel, let’s look at some examples of financial modeling done in the Profit Frog software:

In the following example, we go through three screens of a Profit Frog financial model. In this example, we have a coffee shop business that has decided to launch a food truck to supplement their brick and mortar location. 

The company started the food truck in May of 2022, and the following screenshots allow us to see how the actual outcomes are tracking against the initial model.  

Profit Frog financial model screen #1

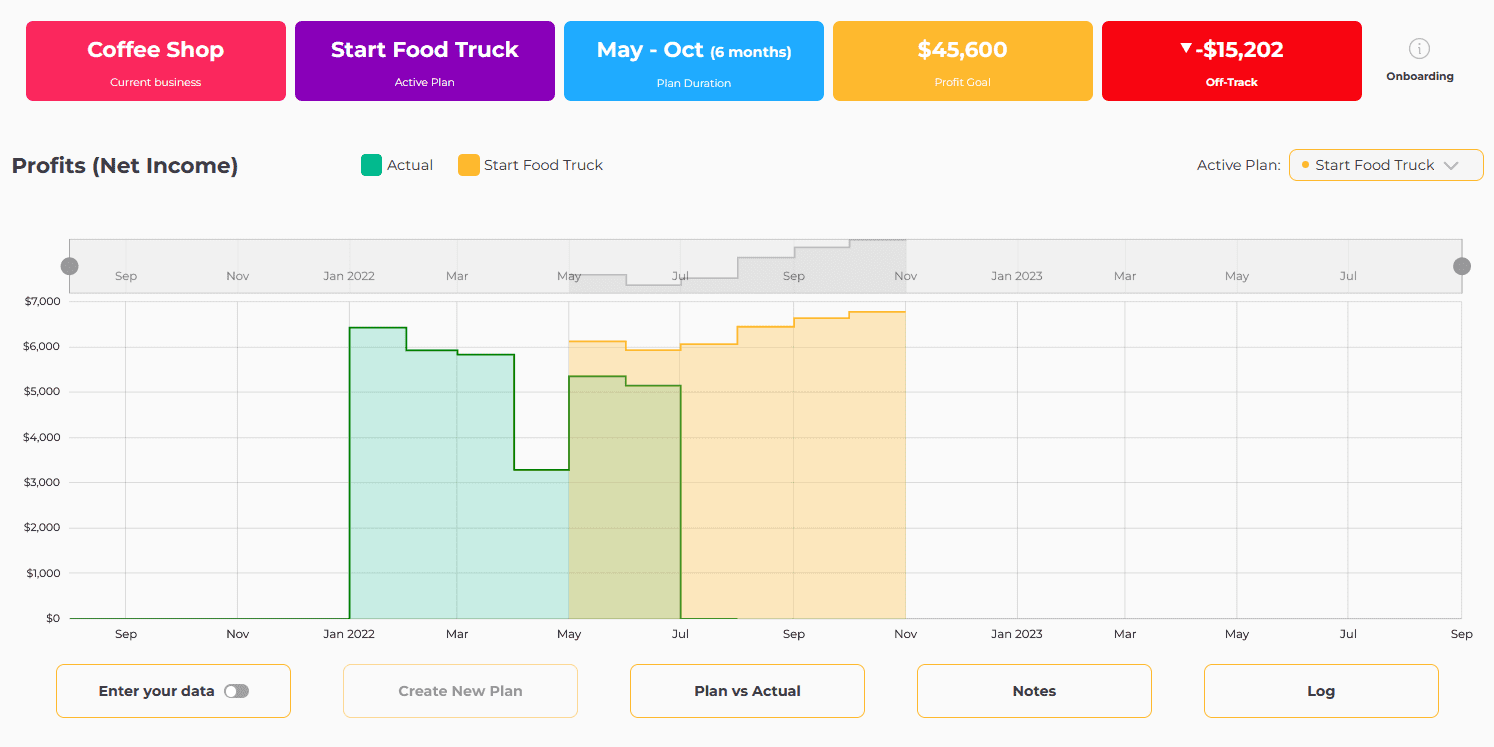
The green graph shows how the food truck actually did, while the yellow graph shows the financial model that was made before the food truck went on the road. By comparing the two graphs, we can see how the business is performing against the financial model (food truck profits are currently $15,202 behind plan).    

Profit Frog financial model screen #2

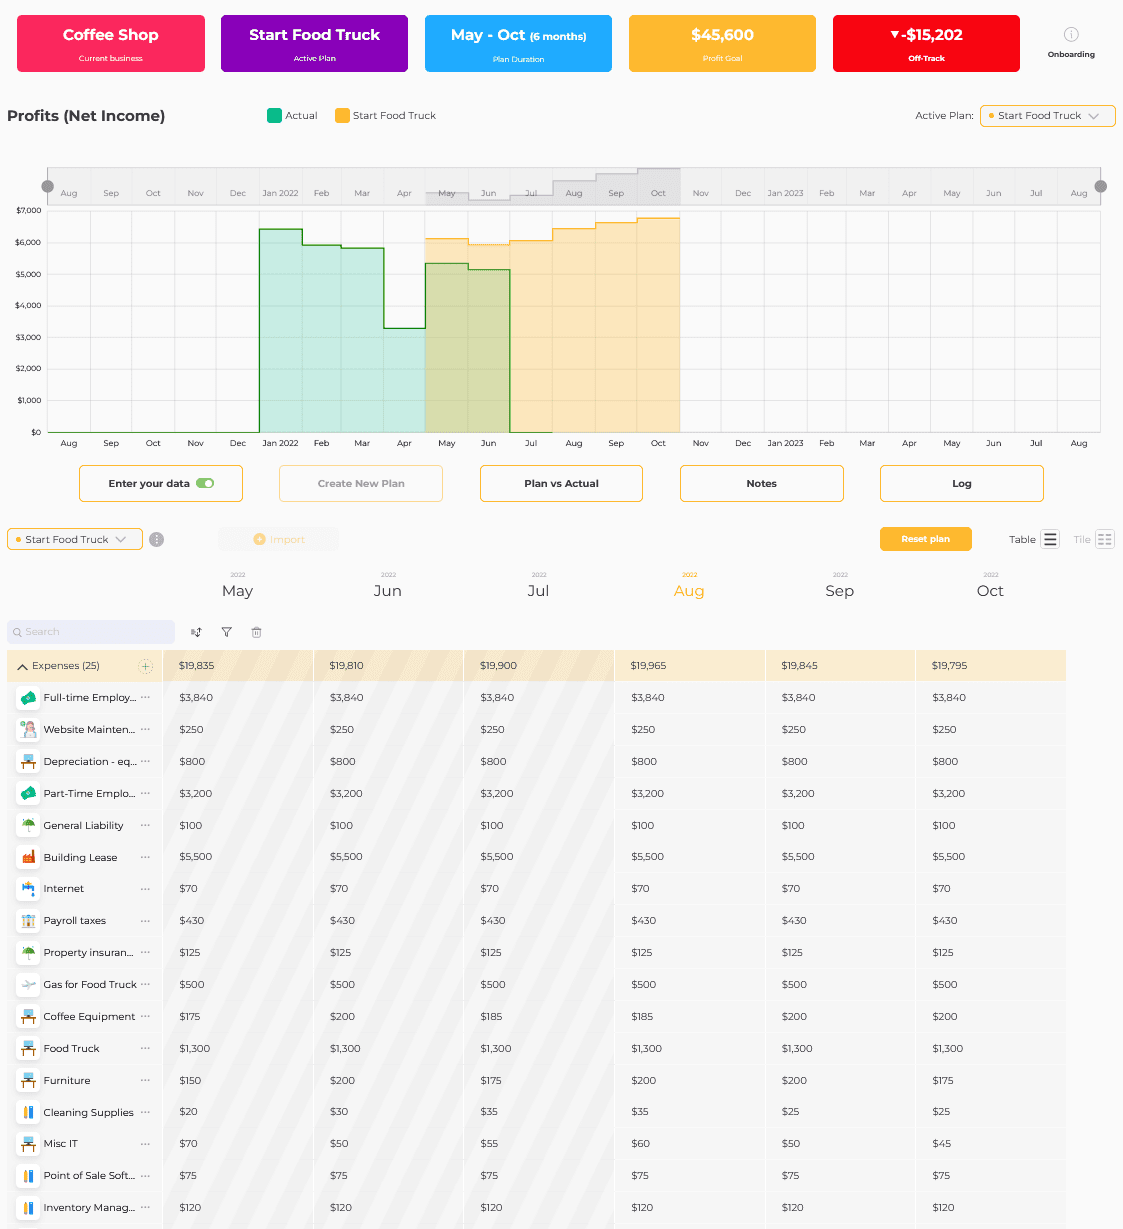
The second view includes the same information as the first, with the addition of all expenses. We can select any expense and enter our estimates by month for each expense on the bottom half of the screen. The yellow graph will update, allowing us to see how our changes to expenses impact our forecast. This allows us to easily make updates each month to our model, based on ongoing performance.  

Profit Frog financial model screen #3

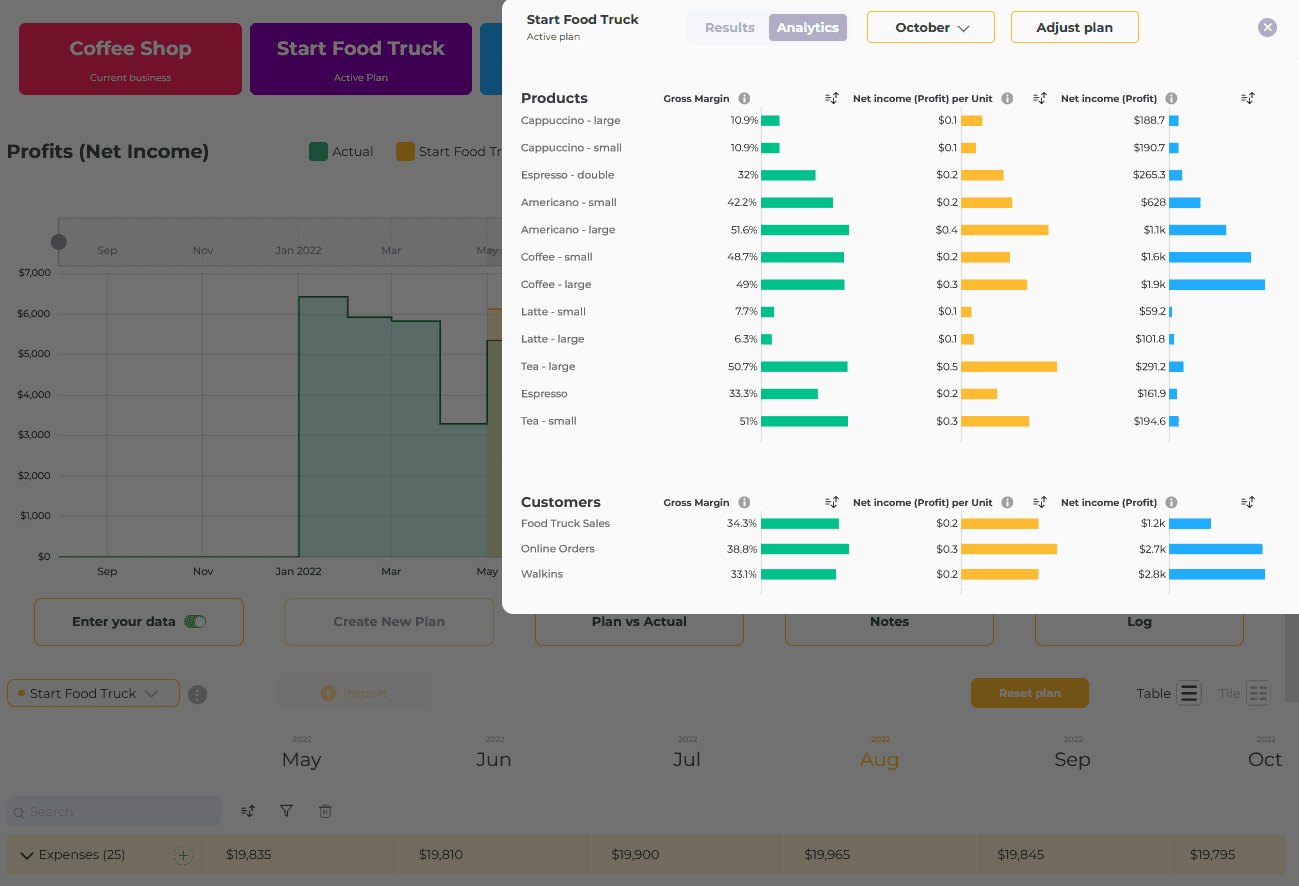
This third screen shows how easy it is to review analytics based on a financial model, and to adjust our plan with a visual data illustration. The graphs illustrate gross margin and net income by product and also by customer. This screen allows us to quickly and easily see a visual representation of our profit, and to adjust the model assumptions visually by clicking on the “Adjust plan” button.  

Profit Frog, as demonstrated above, enables business owners to model various revenue and profit scenarios and then compare them to actuals. It’s easy with Profit Frog, and our customers never even need to touch Excel!  

What is a financial model used for?

Financial models are used for risk management in making strategic business decisions. In the Garden Foods example above, the model was used to help determine whether the company should launch a new subscription product. Financial models can also be useful in the following scenarios:

  • Deciding whether or not to expand a business into a new state
  • Deciding whether to open a new restaurant or add a third food truck
  • Deciding whether to sell on Amazon or your own website
  • Deciding whether to expand a local business into an adjacent town
  • Deciding whether to double one’s sales force
  • Deciding whether to buy or lease industrial equipment
 

The above are just a few of the many different ways a model can be used to aid in making a business plan and assisting with crucial decisions. 

How to build a financial model?

Traditionally, the most common types of financial models are the 3-statement model, DCF models, and M&A models, among many other model varieties. 

  • Integrated 3-statement model: a 3-statement financial model typically used for a business valuation when forecasting the go-forward financial performance of a business, this type of model includes the P&L (profit and loss), income statements, balance sheets, and cash flow statement. 
  • Discounted cash flow analysis (DCF models): this model includes analyzing the cash flows of the business at a certain discount rate to determine how much cash can be expected in today’s terms for undertaking the project. 
  • Merger & acquisition (M&A) model: this is a model that is used when a company is exploring either merging with or acquiring another company. 
  • Budget or forecasting model: this is a model that’s used to help finance departments prepare the budget and forecast for a company. 
  • Consolidation model: this is a model used to roll up or consolidate several different businesses or projects into one model. 
  • Options pricing model: this is a model used to price options for the stock market. 
  • Company comparables model: this is a model that is used to compare different companies together using popular valuation metrics such as the price-to-equity ratio or other popular valuation ratios.
  • Project model: a project model can be any financial model created to analyze project financing for a project a company is considering undertaking. The example shown above for Garden Foods would be an example of a project model. 

If all of these models sound hopelessly complicated for the average small business owner, they are. Profit Frog simplifies this process by focusing on your profit and loss (P&L) and forecasting future scenarios based on your current financial data.

With our small business financial modeling software, you can easily create a financial model of your business—without needing a finance MBA.

What makes a good financial model?

In the words of George E.P. Box:

All models are wrong, but some are useful”

The key to a good financial model is that it helps a business owner make decisions. All financial models are inaccurate to some degree, but is yours useful? Can you back up all the assumptions, and have you made sure there are no mistakes in the assumptions?

If you have built supportable assumptions, and you have the ability to analyze the decision using various key drivers and scenarios, then you have a model that should be useful. If the model is error-prone, lacks solid assumptions, and lacks the ability to adjust various drivers, then you likely have a poor model that will not be of much help. 

How is a financial model validated?

A financial model should be validated by the creator and the end user. They should both go through and validate all the assumptions in the model. The creator should also create checks to ensure no errors are made in the model calculations. Most spreadsheets contain one or more errors, so building error checks into spreadsheet models is integral. 

The more important the model is in a decision-making process, the more robust the validation process should be for a model. For example, let’s assume you are building a model to merge Coke and Pepsi together. This model would be part of a large billion-dollar transaction and would be under high scrutiny to ensure it is free from errors. 

Traditional financial model validation

This would involve using validation software and having a professional third party test and validate the model. For most models, the validation process is much simpler than this, and in some cases can be as simple as the creator reviewing all of the formulas in the model and building a simple check sheet to ensure no major issues exist within the model. 

Financial model validation with Profit Frog

Profit Frog makes the validation process simple by directing the user’s focus to past and future profits in the interactive profit chart.  

At a single glance, you can quickly assess if the model is off by viewing the profit profile.  Because all data is rolled up into the profit profile, users can quickly catch anomalies, and then drill down into revenue by product and customer, COGS by product, and operating expenses to inspect for accuracy.

See why small businesses choose Profit Frog for their financial model needs

Your company’s financials can seem overwhelming if you’re doing them on your own. Luckily, building the financial model of your dreams is what Profit Frog is here for.

By calculating the likely future performance of your company with our financial modeling software, we can help you plan out a scenario that leads to the success of your business.

Get started now and excel in your business management with the help of a comprehensive small business financial model.

Financial modeling FAQ:

What are the common types of models?

Common types of financial models include the 3-statement model, the discount cash flow model, and the forecasting model, among other model types we’ve mentioned above. Profit Frog uses the forecasting model to help small businesses create short-term and long-term forecasts and plan for different scenarios based on those forecasts.

  • Integrated 3-statement model: the 3 statement financial model is commonly used to forecast the go-forward performance of a business; it includes the P&L, balance sheet, and cash flow statements. 
  • Discounted cash flow (DCF): this model includes analyzing the cash flows of the model at a certain discount rate to determine how much cash can be expected in today’s terms for undertaking the project. 
  • Mergers and acquisitions (M&A) model: this is a model that is used when a company is exploring either merging with or acquiring another company. Commonly, it’s used to help ascribe valuation multiples. 
  • Budget and forecasting model: this is the most applicable financial model for small businesses, and the one that Profit Frog integrates into our software.
  • Consolidation model: this is a model used to roll up or consolidate several different businesses or projects into one model. 
  • Options pricing model: this is a model used to price options for the stock market. 
  • Company comparables model: this is a model that is used to compare different companies together using popular valuation metrics such as the price-to-equity ratio or other popular valuation ratios. 
  • Project model: a project model can be any financial model created to analyze project financing for a project a company is considering undertaking. The example shown above for Garden Foods would be an example of a project model. Profit Frog also integrates this model into our forecasting capabilities.

What are the components of financial models?

The main components of a financial model include inputs, outputs, and calculations. A financial model can also include a basic P&L statement or a thorough financial statement analysis, which includes a P&L, a balance sheet, a cash flow statement, and multiple financial schedules designed to support the 3 main financial statements. 

What is financial modeling in Excel?

Most financial modeling for corporate banking and corporate finance is done in Excel.

The reason Excel is so popular is due to the fact that virtually everyone has access to the software, and it is very flexible when it comes to building financial models. 

Some of the drawbacks of Excel include challenges around loading your historical data into the spreadsheet and learning the Excel skills necessary to build complex financial models. Spreadsheets are a good tool for building financial models if you’re an Excel wizard, but they have several limitations, including the fact that they can be time-consuming. 

Most large corporations have entire financial departments that can build complex Excel models. Most small businesses do not. We built Profit Frog for owners of small businesses who need financial modeling to be easier.

What are the best financial modeling tools?

The most common tool for building financial models is a spreadsheet, and the two most common spreadsheets are Excel and Google Sheets. 

  • Building a financial model from scratch can be cumbersome
  • The average small business owner does not have Excel proficiency
  • Financial management, and managing version control, in particular, is quite complex 
  • It can be difficult to collaborate in Excel
  • You have to connect to and work with various data sources
  • Bringing in your actuals can be complicated
 

Some tools can help you do basic financial modeling by putting your past performance and budget together and letting you build models. For example, Profit Frog integrates with your accounting data directly. This allows you to run various business intelligence scenarios and see what happens to your profit based on each scenario. 

What is the comparative company analysis?

Comparative company analysis (CCA) is the process of comparing companies based on certain metrics, and it’s often done by financial analysts. In financial analysis models, comparable companies (businesses with similar metrics) can be compared to determine whether one of the companies is overvalued or undervalued in terms of financial investments. 

What is leveraged buyout modeling?

Leveraged buyout (LBO) modeling is a tool used to evaluate a leveraged buyout, a financial transaction involving a business acquisition (usually private equities) financed by a financial sponsor or an investment banker.

The company’s assets are often used as collateral for the financial loan. An equity research analyst will mainly use the LBO model to evaluate companies when making investment recommendations, and a credit analyst may use it to assess the creditworthiness of a company.

What is sensitivity analysis?

Sensitivity analysis is a financial modeling approach used to analyze the different values of a set of independent variables, and how they may affect a particular dependent variable under specific conditions.

What is the internal rate of return?

The internal rate of return (IRR) is the annual income from an investment expressed as a percentage or a proportion of the original investment. This financial analysis metric is used to estimate the profitability of potential investments.

Further reading on small business finance

Is cost of goods sold a business expense?

How do you know if your product is profitable?

Tips for calculating year-over-year growth

What are the differences between profit and loss and cash flow?

Tips for optimizing your profits

Necessary tools for small business owners

Share this page